an oscilloscope
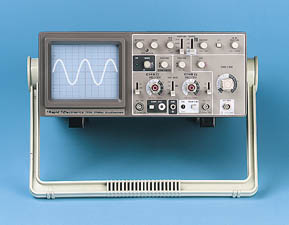
Photograph © Rapid Electronics

Next Page: Power Supplies
Also See: AC, DC and Electrical Signals
|
| Circuit symbol for an oscilloscope |
|
| Cathode Ray Oscilloscope (CRO) Photograph © Rapid Electronics
|
The graph, usually called the trace, is drawn by a beam of electrons striking the phosphor coating of the screen making it emit light, usually green or blue. This is similar to the way a television picture is produced.
Oscilloscopes contain a vacuum tube with a cathode (negative electrode) at one end to emit electrons and an anode (positive electrode) to accelerate them so they move rapidly down the tube to the screen. This arrangement is called an electron gun. The tube also contains electrodes to deflect the electron beam up/down and left/right.
The electrons are called cathode rays because they are emitted by the cathode and this gives the oscilloscope its full name of cathode ray oscilloscope or CRO.
A dual trace oscilloscope can display two traces on the screen, allowing you to easily compare the input and output of an amplifier for example. It is well worth paying the modest extra cost to have this facility.
There is some variation in the arrangement and labelling of the many controls so the following instuctions may need to be adapted for your instrument.
 |
| This is what you should see after setting up, when there is no input signal connected
|
 |
| Construction of a co-axial lead |
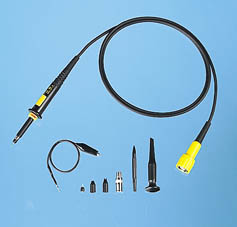 |
| Oscilloscope lead and probes kit Photograph © Rapid Electronics |
Most oscilloscopes have a BNC socket for the y input and the lead is connected with a push and twist action, to disconnect you need to twist and pull. Oscilloscopes used in schools may have red and black 4mm sockets so that ordinary, unscreened, 4mm plug leads can be used if necessary.
Professionals use a specially designed lead and probes kit for best results with high frequency signals and when testing high resistance circuits, but this is not essential for simpler work at audio frequencies (up to 20kHz).
An oscilloscope is connected like a voltmeter but you must be aware that the screen (black) connection of the input lead is connected to mains earth at the oscilloscope! This means it must be connected to earth or 0V on the circuit being tested.
|
|
 |
| The trace of an AC signal with the oscilloscope controls correctly set |
Further information on the controls: Timebase |
Y amplifier | AC/GND/DC switch
 The trace on an oscilloscope screen is a graph of voltage against time.
The shape of this graph is determined by the nature of the input signal.
The trace on an oscilloscope screen is a graph of voltage against time.
The shape of this graph is determined by the nature of the input signal.
In addition to the properties labelled on the graph, there is frequency which is the number of cycles per second.
The diagram shows a sine wave but these properties apply to any signal with a
constant shape.
| frequency = | 1 | and | time period = | 1 |
| time period | frequency |
|
|
|
| The trace of an AC signal Y AMPLIFIER: 2V/cm Example measurements: peak-peak voltage = 8.4V time period = 20ms |
If you wish to read the amplitude voltage directly you must check the position of 0V (normally halfway up the screen): move the AC/GND/DC switch to GND (0V) and use Y-SHIFT (up/down) to adjust the position of the trace if necessary, switch back to DC afterwards so you can see the signal again.
Voltage = distance in cm × volts/cm
Example: peak-peak voltage = 4.2cm × 2V/cm = 8.4V
amplitude (peak voltage) = ½ × peak-peak voltage = 4.2V
Ensure that the variable timebase control is set to 1 or CAL (calibrated) before attempting to take a time reading.
Time = distance in cm × time/cm
Example: time period = 4.0cm × 5ms/cm = 20ms
and frequency = 1/time period =
1/20ms = 50Hz
 |
| Slow timebase, no input You can see the dot moving
|
|
| Fast timebase, no input The dot is too fast to see so it appears to be a line |
At slow timebase settings (such as 50ms/cm) you can see a dot moving across the screen but at faster settings (such as 1ms/cm) the dot is moving so fast that it appears to be a line.
The VARIABLE timebase control can be turned to make a fine adjustment to the speed, but it must be left at the position labelled 1 or CAL (calibrated) if you wish to take time readings from the trace drawn on the screen.
The TRIGGER controls are used to maintain a steady trace on the screen. If they are set wrongly you may see a trace drifting sideways, a confusing 'scribble' on the screen, or no trace at all! The trigger maintains a steady trace by starting the dot sweeping across the screen when the input signal reaches the same point in its cycle each time.
For straightforward use it is best to leave the trigger level set to AUTO, but if you have
difficulty obtaining a steady trace try adjusting this control to set the level manually.
 |
| Varying DC (always positive) |
The y amplifier control may be labelled Y-GAIN or VOLTS/CM.
The input voltage moving the dot up and down at the same time as the dot is swept across the
screen means that the trace on the screen is a graph of voltage (y-axis) against
time (x-axis) for the input signal.
|
| Switching to GND allows you to quickly check the position of 0V (normally halfway up).
|
Switching to GND (ground) connects the y input to 0V and allows you to quickly check the position of 0V on the screen (normally halfway up). There is no need to disconnect the input lead while you do this because it is disconnected internally.
Switching to AC inserts a capacitor in series with the input to block out any DC signal present and pass only AC signals. This is used to examine signals showing a small variation around one constant value, such as the ripple on the output of a smooth DC supply. Reducing the VOLTS/CM to see more detail of the ripple would normally take the trace off the screen! The AC setting removes the constant (DC) part of the signal, allowing you to view just the varying (AC) part which can now be examined more closely by reducing the VOLTS/CM. This is shown in the diagrams below:
| Displaying a ripple signal using the AC switch | ||
 |
 |
 |
| Switch in normal DC position.
The ripple is difficult to see, but if VOLTS/CM is reduced to enlarge it the trace will disappear off the screen! |
Switch moved to AC position.
The constant (DC) part of the signal is removed, leaving just the ripple (AC) part. |
VOLTS/CM reduced to enlarge the ripple. The ripple can now be examined more closely. |